Best Time to Sell? When Competition Is at an All-Time Low

Best Time to Sell? When Competition Is at an All-Time Low

Best Time to Sell? When Competition Is at an All-Time Low

Best Time to Sell? When Competition Is at an All-Time Low | MyKCM

In a recent survey of home sellers by Qualtrics, 87% of respondents said they were concerned their home won’t sell because of the pandemic and resulting economic recession. Of the respondents, 51% said they are “seriously worried.” That concern seems reasonable considering the current condition of the economy. The data, however, is showing that home purchasers are still very active despite the disruptions American families have experienced this year.

The latest Existing Home Sales Report published by the National Association of Realtors (NAR) revealed that 340,000 single-family homes sold in this country last month. NAR’s most recent Pending Sales Report (homes going into contract) surpassed last month’s number by over 44%, which far exceeded analysts’ projections of 15%. ShowingTime reported that appointments to see homes (both virtually and in-person) have increased in every region of the country and are up 21.4% nationwide over the same time last year.

While buyer activity is surging, the number of listings has fallen to an all-time low. Zelman Associates, in their latest residential real estate report, revealed that housing inventory as a percentage of households has fallen to 1.2%, which is half of the long-term average and lower than any other time in our history.

Bidding Wars Heating Up Again

With buyer demand growing and the supply of available homes shrinking, purchasers are again finding themselves needing to outbid other buyers. NAR, in a recent blog post, revealed:

“On average, there were about three offers on a home that closed in May, up from just about two in April 2020 and in May 2019 (2.3 offers).”

Bidding wars guarantee houses sell quickly at a price near or even slightly over the listing price.

Inventories are lower than ever before! Utah Single Family Homes in the Wasatch Front Multiple Listing Service showed on July 1 a Statewide number of 6075 With Salt Lake County at 1604 Single Family and Utah County at only 1238 active single family listings.

Bottom Line

If you’re thinking of selling, don’t be concerned about putting your house on the market right now. There’s no better time to sell an item than when demand for it is high and supply is low. It is exactly at that time when you will negotiate your best possible deal.

 
Taking Advantage of Homebuying Affordability in Today’s Market

Taking Advantage of Homebuying Affordability in Today’s Market

Taking Advantage of Homebuying Affordability in Today’s Market

Taking Advantage of Homebuying Affordability in Today’s Market | MyKCM

Everyone is ready to buy a home at different times in their lives, and despite the health crisis, today is no exception. Understanding how affordability works and the main market factors that impact it may help those who are ready to buy a home narrow down their optimal window of time to make a purchase.

There are three main factors that go into determining how affordable homes are for buyers:

  1. Mortgage Rates
  2. Mortgage Payments as a Percentage of Income
  3. Home Prices

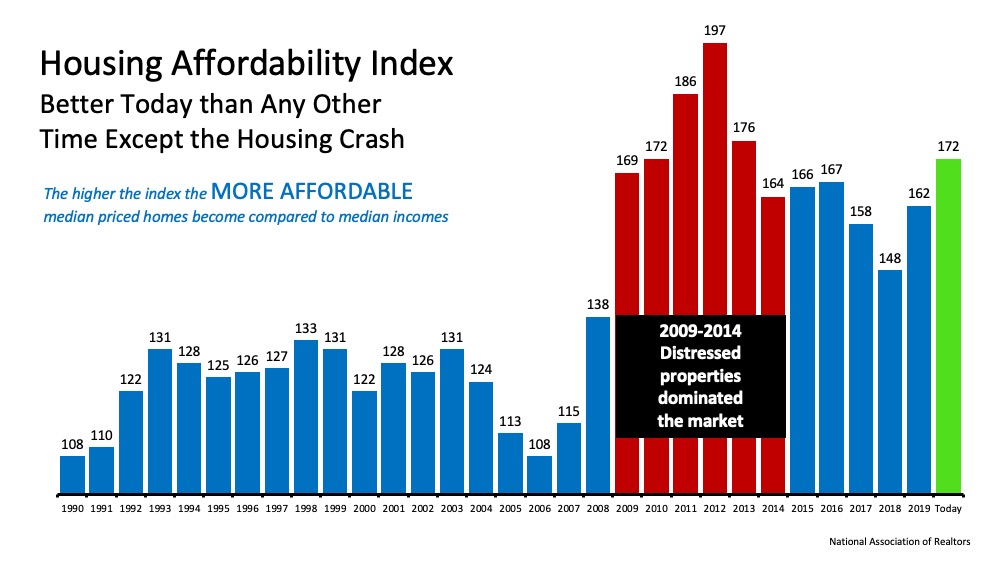
The National Association of Realtors (NAR), produces a Housing Affordability Index, which takes these three factors into account and determines an overall affordability score for housing. According to NAR, the index:

“…measures whether or not a typical family earns enough income to qualify for a mortgage loan on a typical home at the national and regional levels based on the most recent price and income data.”

Their methodology states:

“To interpret the indices, a value of 100 means that a family with the median income has exactly enough income to qualify for a mortgage on a median-priced home. An index above 100 signifies that family earning the median income has more than enough income to qualify for a mortgage loan on a median-priced home, assuming a 20 percent down payment.”

So, the higher the index, the more affordable it is to purchase a home. Here’s a graph of the index going back to 1990:Taking Advantage of Homebuying Affordability in Today’s Market | MyKCMThe green bar represents today’s affordability. We can see that homes are more affordable now than they have been at any point since the housing crash when distressed properties (foreclosures and short sales) dominated the market. Those properties were sold at large discounts not seen before in the housing market.

Why are homes so affordable today?

Although there are three factors that drive the overall equation, the one that’s playing the largest part in today’s homebuying affordability is historically low mortgage rates. Based on this primary factor, we can see that it is more affordable to buy a home today than at any time in the last seven years.

If you’re considering purchasing your first home or moving up to the one you’ve always hoped for, it’s important to understand how affordability plays into the overall cost of your home. With that in mind, buying while mortgage rates are as low as they are now may save you quite a bit of money over the life of your home loan.

Bottom Line

If you feel ready to buy, purchasing a home this season may save you significantly over time based on historic affordability trends. Let’s connect today to determine if now is the right time for you to make your move.

A Historic Rebound for the Housing Market

A Historic Rebound for the Housing Market

A Historic Rebound for the Housing Market

A Historic Rebound for the Housing Market | MyKCM

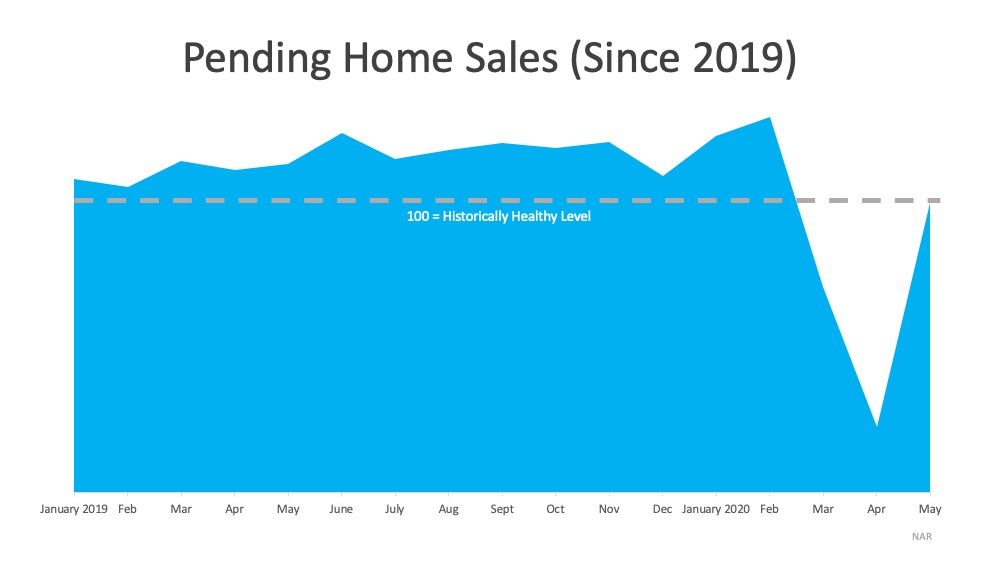
Pending Home Sales increased by 44.3% in May, registering the highest month-over-month gain in the index since the National Association of Realtors (NAR) started tracking this metric in January 2001. So, what exactly are pending home sales, and why is this rebound so important?

According to NAR, the Pending Home Sales Index (PHS) is:

“A leading indicator of housing activity, measures housing contract activity, and is based on signed real estate contracts for existing single-family homes, condos, and co-ops. Because a home goes under contract a month or two before it is sold, the Pending Home Sales Index generally leads Existing-Home Sales by a month or two.”

In real estate, pending home sales is a key indicator in determining the strength of the housing market. As mentioned before, it measures how many existing homes went into contract in a specific month. When a buyer goes through the steps to purchase a home, the final one is the closing. On average, that happens about two months after the contract is signed, depending on how fast or slow the process takes in each state.

Why is this rebound important?

With the COVID-19 pandemic and a shutdown of the economy, we saw a steep two-month decline in the number of houses that went into contract. In May, however, that number increased dramatically (See graph below):A Historic Rebound for the Housing Market | MyKCMThis jump means buyers are back in the market and purchasing homes right now. Lawrence Yun, Chief Economist at NAR mentioned:

“This has been a spectacular recovery for contract signings and goes to show the resiliency of American consumers and their evergreen desire for homeownership…This bounce back also speaks to how the housing sector could lead the way for a broader economic recovery.”

But in order to continue with this trend, we need more houses for sale on the market. Yun continues to say:

“More listings are continuously appearing as the economy reopens, helping with inventory choices…Still, more home construction is needed to counter the persistent underproduction of homes over the past decade.”

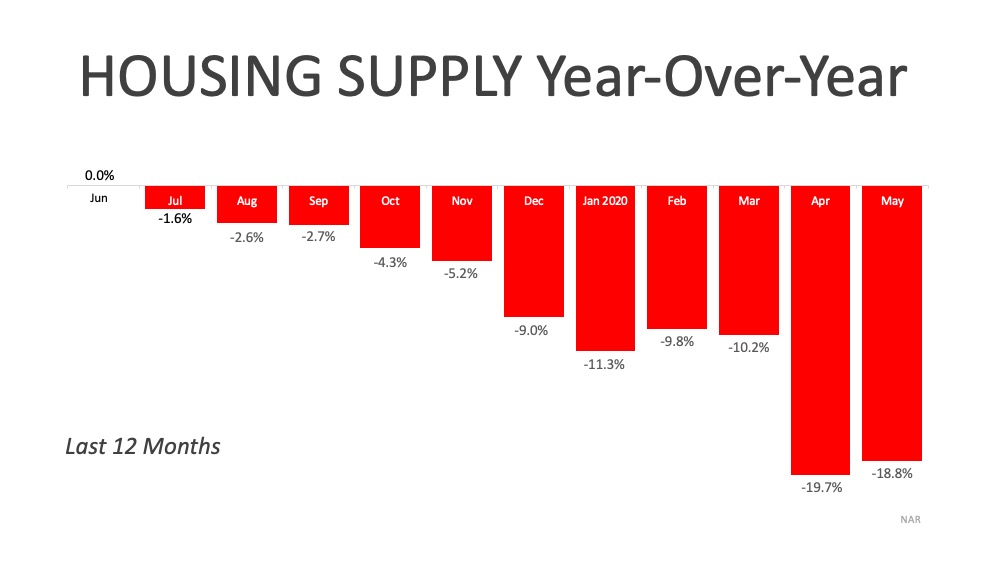
As we move through the year, we’ll see an increase in the number of houses being built. This will help combat a small portion of the inventory deficit. The lack of overall inventory, however, is still a challenge, and it is creating an opportunity for homeowners who are ready to sell. As the graph below shows, during the last 12 months, the supply of homes for sale has been decreasing year-over-year and is not keeping up with the demand from homebuyers.A Historic Rebound for the Housing Market | MyKCM

Bottom Line

If you decided not to sell this spring due to the health crisis, maybe it’s time to jump back into the market while buyers are actively looking for homes. Let’s connect today to determine your best move forward.

Is the Health Crisis Driving Buyers Out of Urban Areas?

Is the Health Crisis Driving Buyers Out of Urban Areas?

Is the Health Crisis Driving Buyers Out of Urban Areas?

Is the Health Crisis Driving Buyers Out of Urban Areas? | MyKCM

The pandemic has caused consumers to re-examine the components that make up the “perfect home.” Many families are no longer comfortable with the locations and layouts of their existing homes. The allure of city life (more congested) seems to be giving way to either suburban or rural life (less congested). The fascination with an open floor plan seems to be fading as people are finding a need for more privacy while working from home.

Recently, news.com released a report that revealed how buyers’ views of listings are leaning heavily to more suburban and rural properties. Here are the year-over-year percentage increases in views per property type:

  • Urban – 7%
  • Suburban – 13%
  • Rural – 16%

In the report, Javier Vivas, Director of Economic Research for realtor.com, gives these numbers some context:

“This migration to the suburbs is not a new trend, but it has become more pronounced. After several months of shelter-in-place orders, the desire to have more space and the potential for more people to work remotely are likely two of the factors contributing to the popularity of the burbs.”

Realtor Magazine also just reported that the desire to move is strongest in our city markets:

“Nearly 30% of respondents living in a high-density urban area say that the pandemic is prompting them to want to move by the end of the year…This is more than double the rate of those living in rural parts of the country, where residents are much more likely to stay put rather than to relocate.”

New Construction Also Seeing a Surge in Views

Since the pandemic has altered how consumers think about floor plans, builders are anticipating how future homes will change. In a recent press release by Zillow, it was explained that:

  • Builders believe as people spend more time at home during the pandemic, buyers are realizing which features of their homes are working and not working.
  • Homebuilders predict open-concept floor plans will be a thing of the past, as people now value more walls, doors, and overall privacy.
  • New construction, which offers the chance to personalize home features, saw its listing page views grow by 73% over last May.

The Virus is Even Impacting the Luxury Second-Home Market

It appears that COVID-19 is impacting the luxury market too. In an article released last week titled, Luxury Buyers Return to Market in Force, Danielle Hale, Chief Economist for realtor.com reported:

“Stay at home orders and social distancing have put a new value on the extra space. We’re seeing this in the luxury market as well, which could mean there is renewed interest from high-end buyers to find a second-home that is within driving distance from their primary residence.

Much like the suburbs are gaining favor with home shoppers, second home markets are seeing increased interest from luxury buyers…Views of luxury properties accelerated 56% in The Hamptons, 28% in Palm Springs and 24% in Greenwich compared to January trends.”

Bottom Line

It appears that a percentage of people are preparing to leave many American cities. Some of these moves will be permanent, while others will be temporary (such as a getaway to a second home). In either case, many consumers are on the move. Real estate professionals are ready and willing to help in any way they can.

A Historic Rebound for the Housing Market

A Historic Rebound for the Housing Market

A Historic Rebound for the Housing Market

A Historic Rebound for the Housing Market | MyKCM

Pending Home Sales increased by 44.3% in May, registering the highest month-over-month gain in the index since the National Association of Realtors (NAR) started tracking this metric in January 2001. So, what exactly are pending home sales, and why is this rebound so important?

According to NAR, the Pending Home Sales Index (PHS) is:

“A leading indicator of housing activity, measures housing contract activity, and is based on signed real estate contracts for existing single-family homes, condos, and co-ops. Because a home goes under contract a month or two before it is sold, the Pending Home Sales Index generally leads Existing-Home Sales by a month or two.”

In real estate, pending home sales is a key indicator in determining the strength of the housing market. As mentioned before, it measures how many existing homes went into contract in a specific month. When a buyer goes through the steps to purchase a home, the final one is the closing. On average, that happens about two months after the contract is signed, depending on how fast or slow the process takes in each state.

Why is this rebound important?

With the COVID-19 pandemic and a shutdown of the economy, we saw a steep two-month decline in the number of houses that went into contract. In May, however, that number increased dramatically (See graph below):A Historic Rebound for the Housing Market | MyKCMThis jump means buyers are back in the market and purchasing homes right now. Lawrence Yun, Chief Economist at NAR mentioned:

“This has been a spectacular recovery for contract signings and goes to show the resiliency of American consumers and their evergreen desire for homeownership…This bounce back also speaks to how the housing sector could lead the way for a broader economic recovery.”

But in order to continue with this trend, we need more houses for sale on the market. Yun continues to say:

“More listings are continuously appearing as the economy reopens, helping with inventory choices…Still, more home construction is needed to counter the persistent underproduction of homes over the past decade.”

As we move through the year, we’ll see an increase in the number of houses being built. This will help combat a small portion of the inventory deficit. The lack of overall inventory, however, is still a challenge, and it is creating an opportunity for homeowners who are ready to sell. As the graph below shows, during the last 12 months, the supply of homes for sale has been decreasing year-over-year and is not keeping up with the demand from homebuyers.A Historic Rebound for the Housing Market | MyKCM

Bottom Line

If you decided not to sell this spring due to the health crisis, maybe it’s time to jump back into the market while buyers are actively looking for homes. Let’s connect today to determine your best move forward.

Buy Owner In Utah, Think You Should For Sale By Owner? Think Again

Buy Owner In Utah, Think You Should For Sale By Owner? Think Again

Think You Should For Sale By Owner? Think Again

Think You Should For Sale By Owner? Think Again [INFOGRAPHIC] | MyKCM

Some Highlights 

  • For Sale By Owner (FSBO) is the process of selling real estate without the representation of a real estate broker or real estate agent.
  • According to the National Association of Realtors’ Profile of Home Buyers & Sellers, 35% of homeowners who decided to FSBO last year did so to avoid paying a commission or fee. But, homes sold with an agent net 6% more than those sold as a FSBO according to Collateral Analytics.
  • Before you decide to take on the challenge of selling your house on your own, let’s connect to discuss your options.

PEAR | PROFESSIONAL EQUITY ASSESSMENT REPORT (Free) 

Pin It on Pinterest